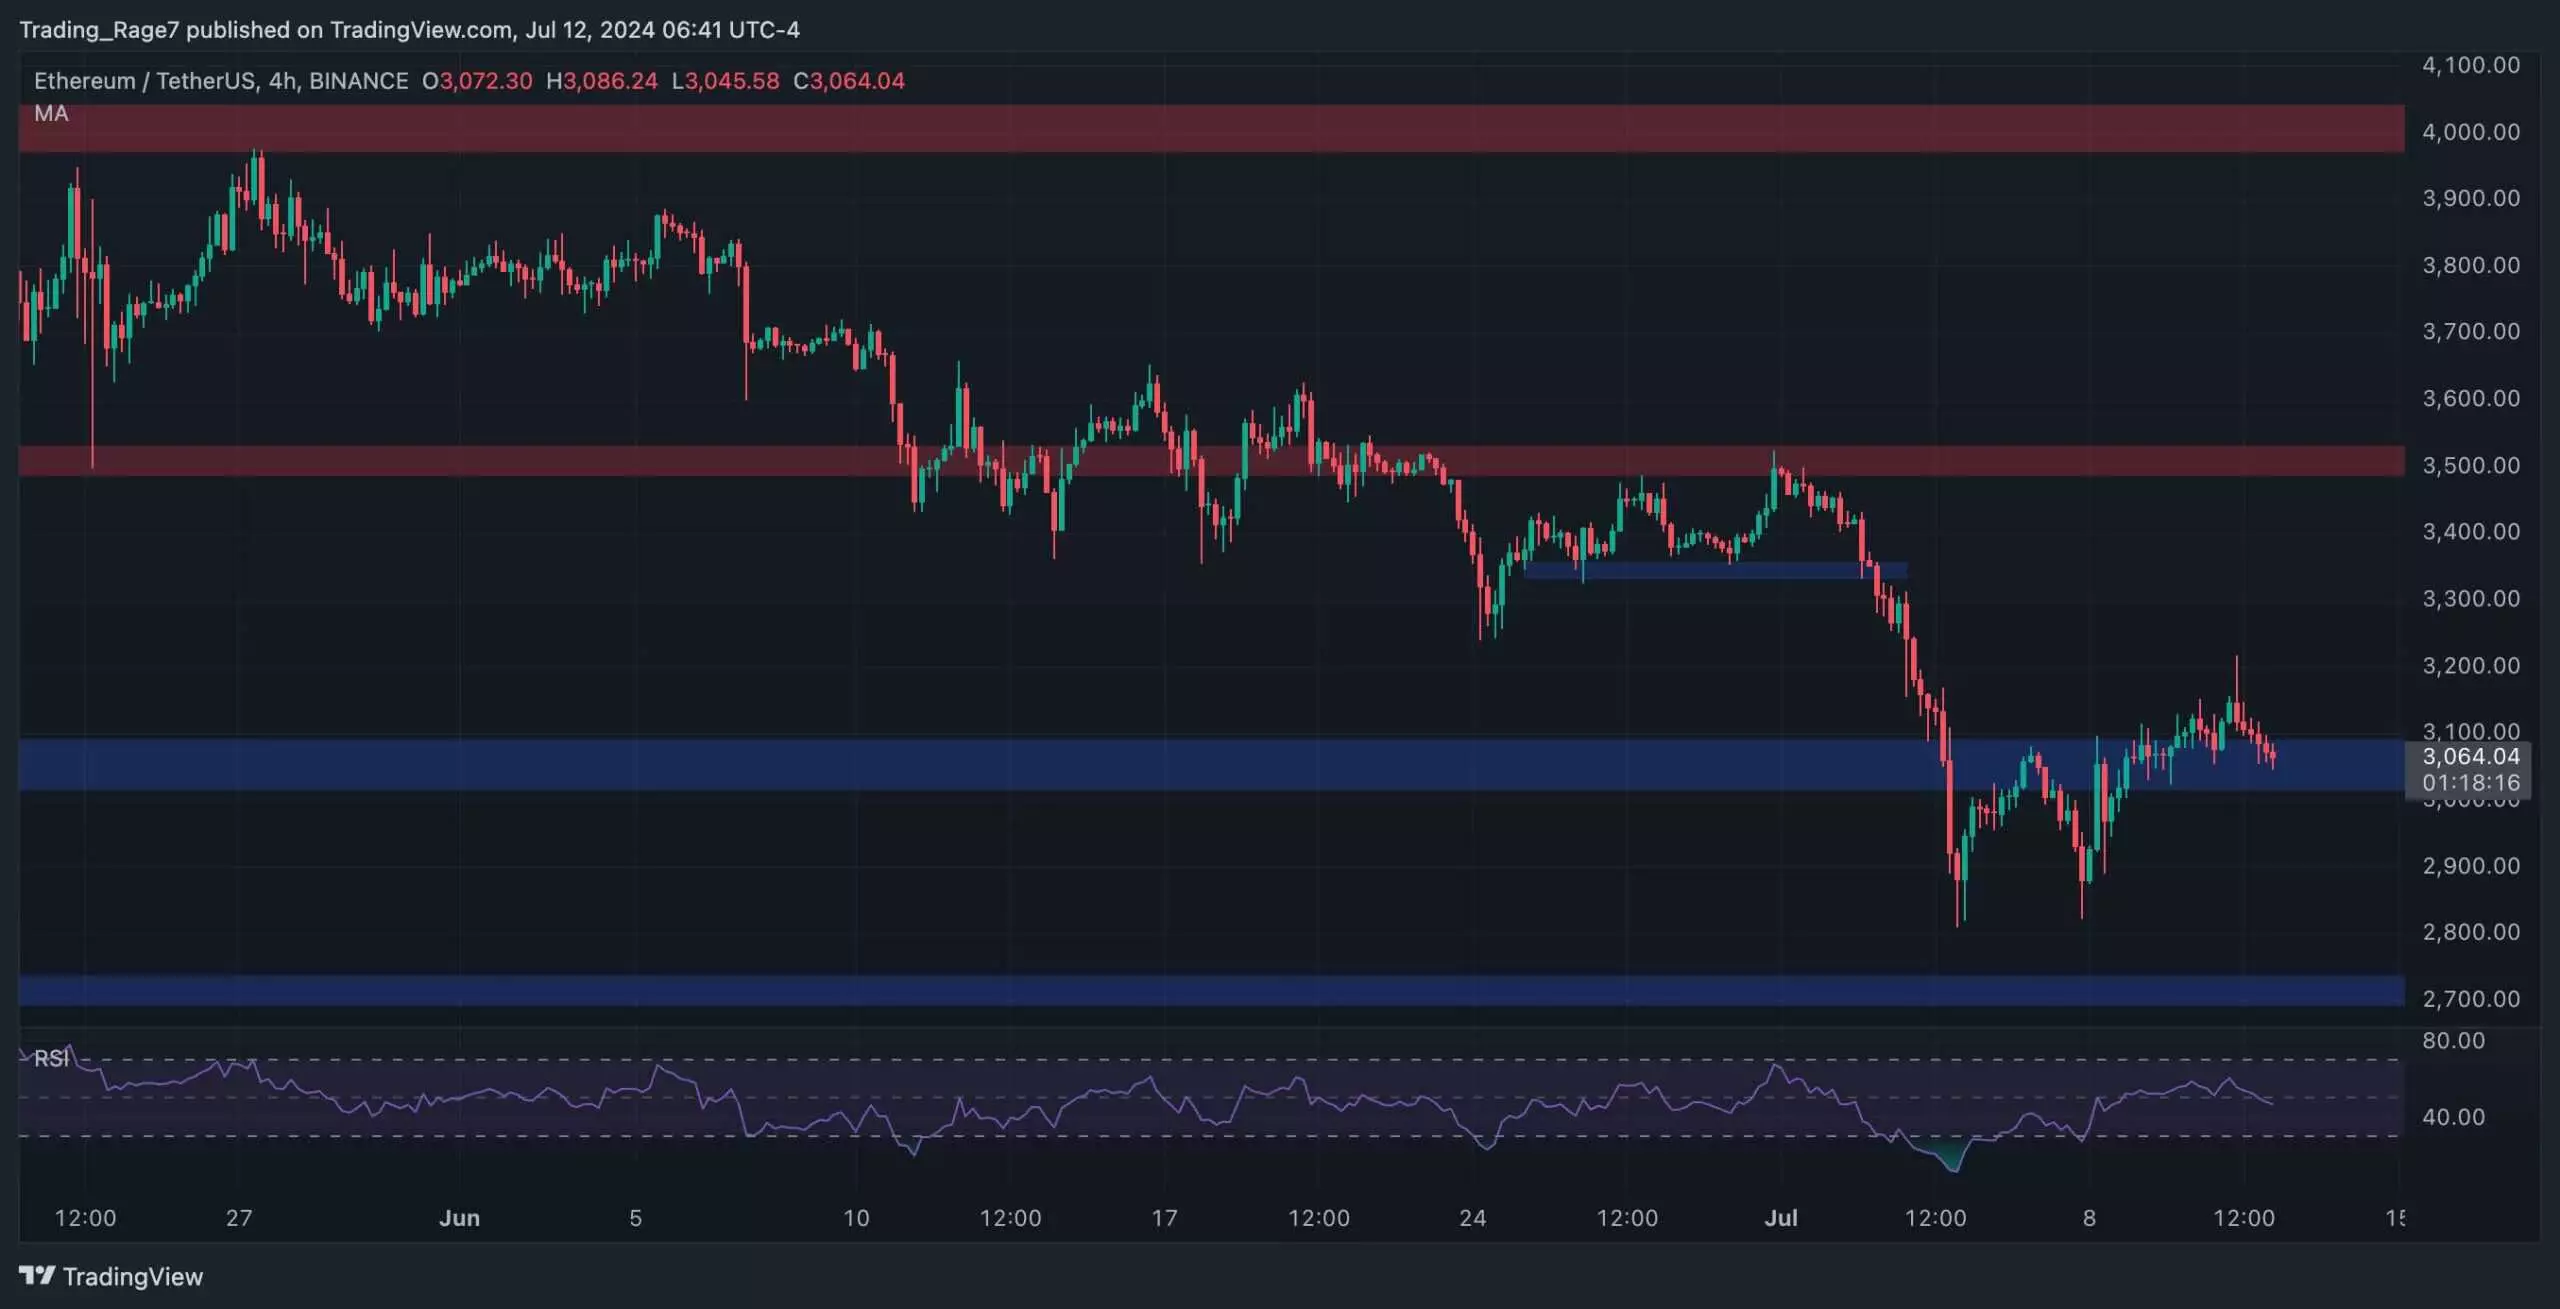
Ethereum’s price has been on a downward trend recently, facing a second rejection at the $4,000 resistance level. The daily chart shows a pattern of lower highs and lows since failing to break the $4,000 mark. Additionally, the market has broken below the crucial 200-day moving average at around $3,100. Currently, the price is retesting this moving average but facing rejection to the downside. This indicates a potential drop towards the $2,700 support level in the near term.
Zooming in on the 4-hour chart reveals a more detailed view of recent price movements. The downtrend has intensified, with a brief break below the $3,000 support level. Despite an oversold signal from the RSI, the price managed to bounce back above this support zone. However, there seems to be a lack of momentum for further upward movement, suggesting a possible deeper decline towards the $2,700 level.
During Ethereum’s recent downtrend, analysts have been searching for signs of capitulation that could signal a potential bottom. One key metric to watch is the Ethereum Exchange Reserve, which tracks the amount of ETH held in exchange wallets. An increase in this metric indicates potential selling pressure, while a decrease suggests a decrease in supply. Following the dip below $3,000, the exchange reserve metric has risen above its 30-day moving average. This uptick may indicate the beginning of the capitulation phase, as investors’ stop losses were likely placed below the $3,000 level.
Ethereum’s price is facing downward pressure and struggling to break above key resistance levels. The current trend suggests a possible drop towards the $2,700 support level. However, signs of capitulation could signal a potential bottom and eventual recovery. Investors should monitor the price action closely and consider the impact of external factors on Ethereum’s price movement. The cryptocurrency market remains volatile, and caution is advised when making trading decisions.


Leave a Reply