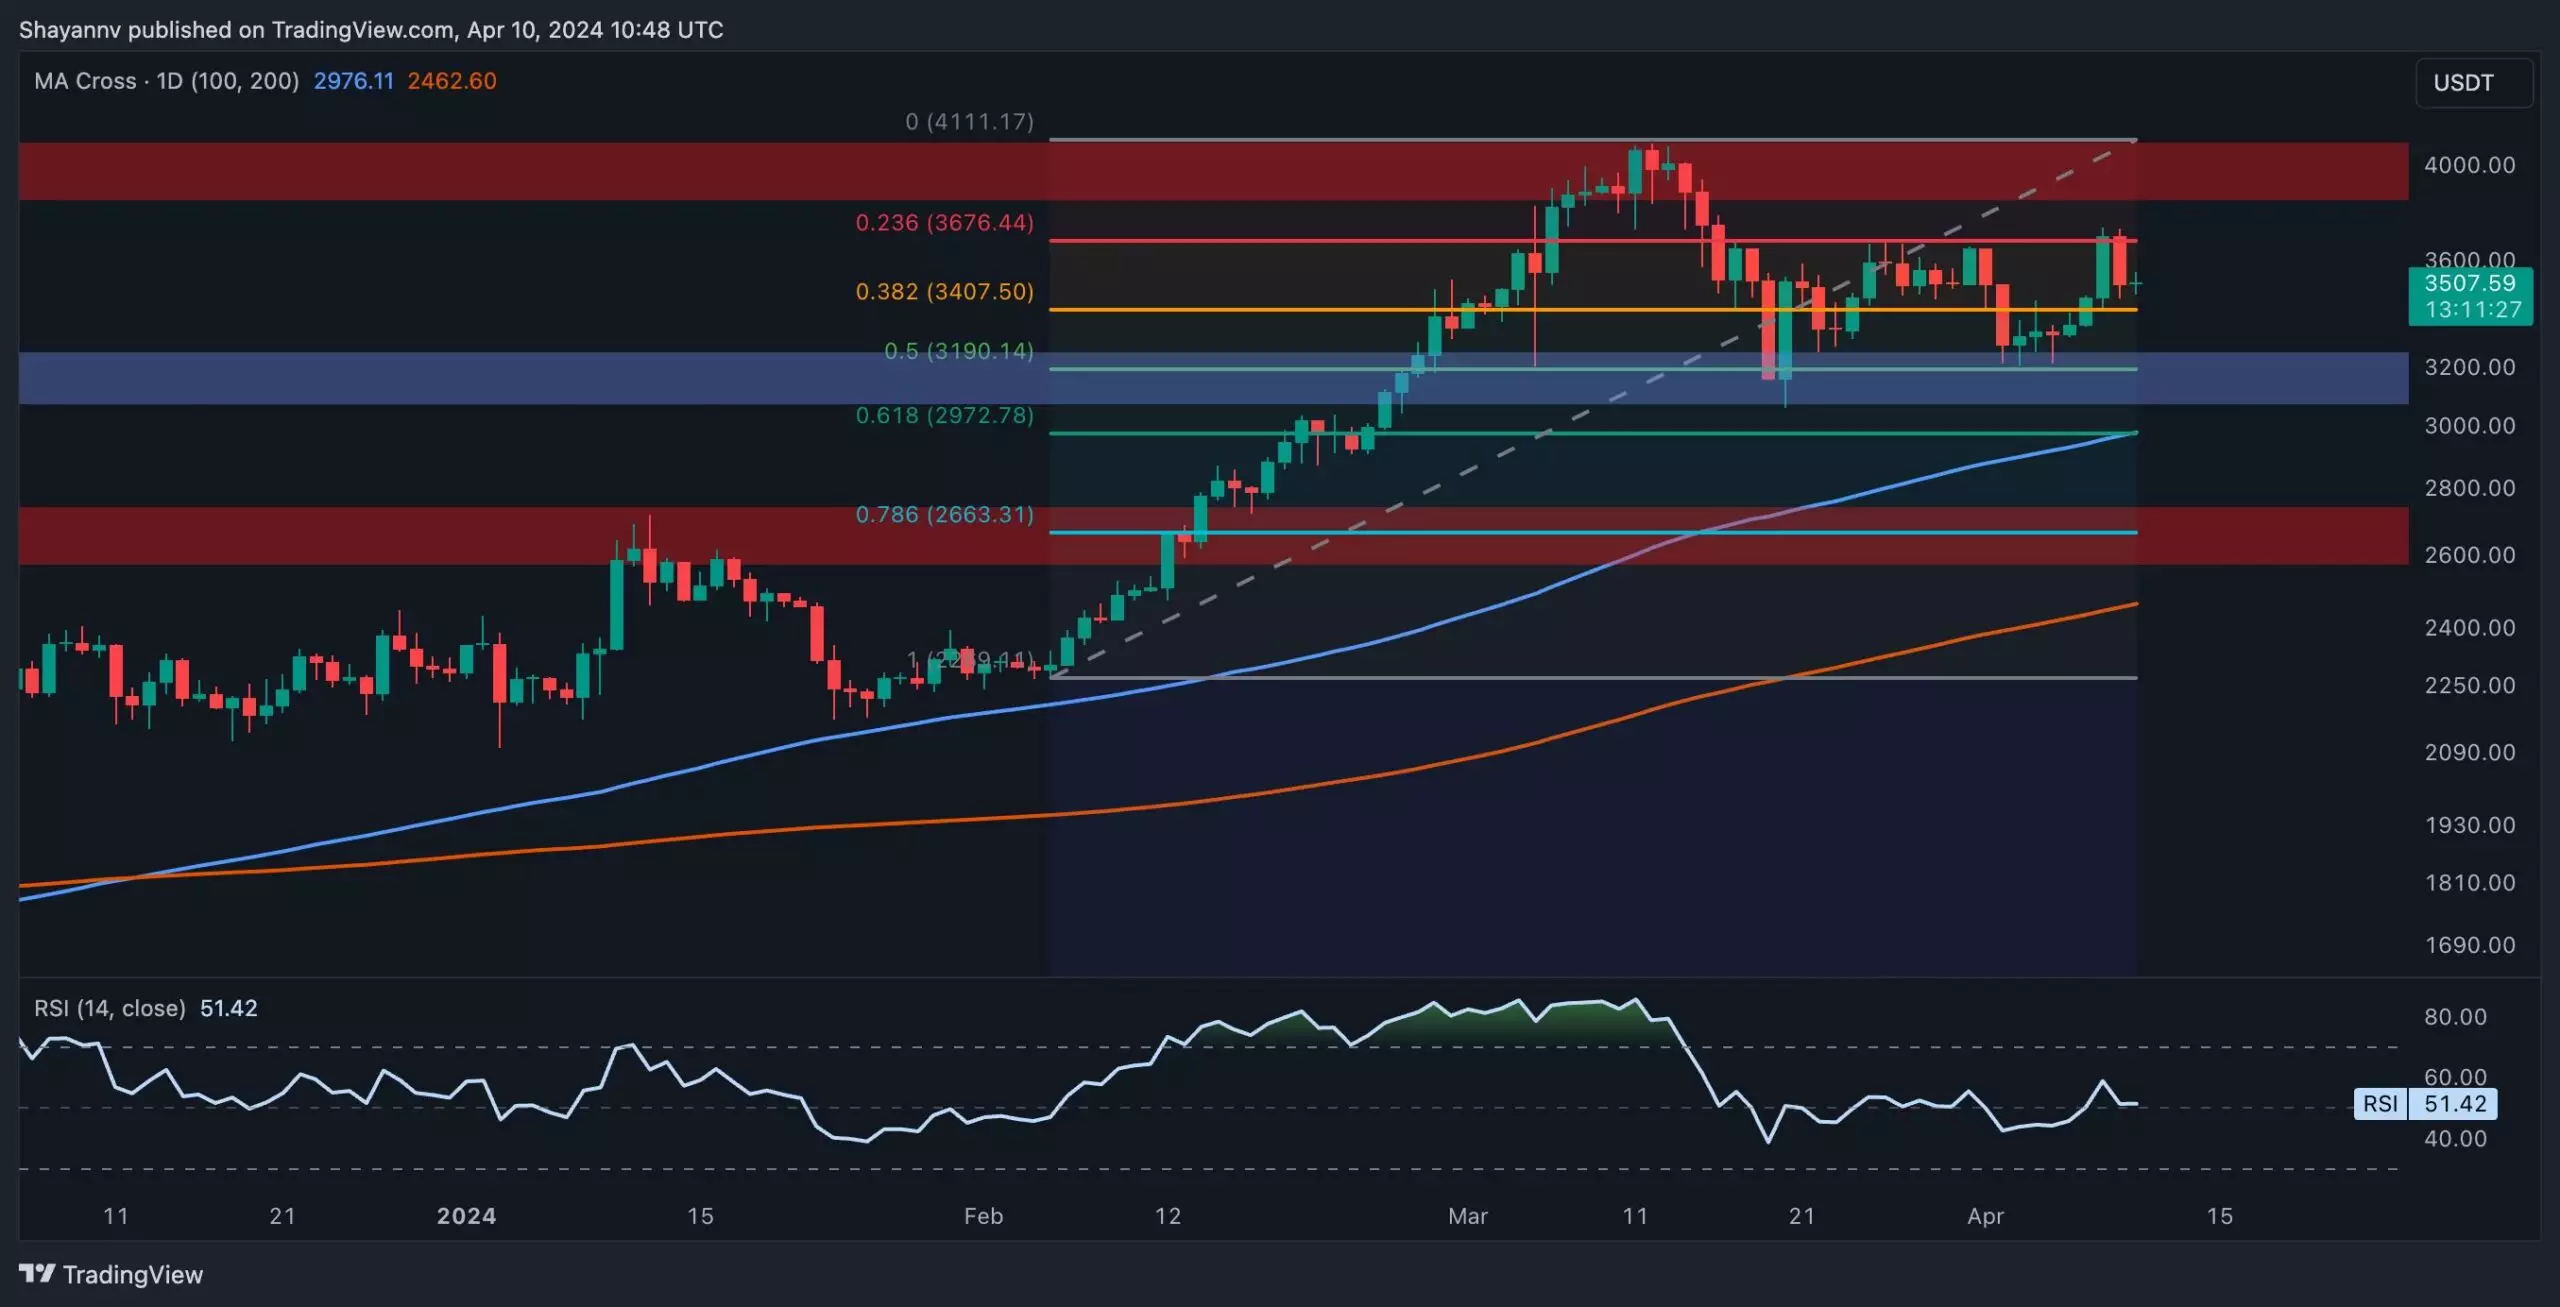
Ethereum has been going through a period of sideways consolidation after a drop to the critical support level of $3,000. Currently, the cryptocurrency is trading within a range of $3,000 and $3,700, showing little signs of volatility unless a breakout occurs in either direction. The daily chart analysis reveals Ethereum’s extended consolidation phase after finding strong support around the $3,000 mark. This area coincides with key Fibonacci retracement levels and the 100-day moving average at $2,972. The confluence of these support levels led to a rebound in ETH’s price, pushing it towards the upper boundary of the range at $3,700. However, recent price action faced resistance near this level, indicating selling pressure at this critical point. Despite this, Ethereum remains in a sideways consolidation phase, with traders hoping for a bullish breakthrough above the $3,700 level.
4-Hour Chart Analysis
A closer look at the 4-hour chart shows the formation of a sideways wedge pattern during corrective retracements. Such patterns usually suggest a continuation of the bullish trend once there is a breakout above the upper boundary. Ethereum witnessed significant buying activity around the $3,000 support area, leading to a renewed bullish momentum that broke through the upper boundary of the wedge. This highlights the strength of buyers in the market. However, upon reaching the resistance level of $3,700, Ethereum faced rejection, prompting a minor pullback. Currently, after this retracement, the price has retraced to the broken wedge level, potentially completing a pullback phase. If this pullback is successful, Ethereum’s price could see another upward movement towards the $3,700 level. On the flip side, a bearish retracement could find support at $3,200.
Spot Market Analysis
While Ethereum’s price has shown signs of recovery, it is important to assess whether this is driven by spot buying or leveraged futures positions. Looking at the exchange reserve metric, which measures the amount of ETH held on exchange wallets, it is evident that after a spike above the 30-day moving average a few weeks ago, the metric has now dropped below the MA once again. This signals that investors are withdrawing ETH from exchanges, indicating spot buying pressure. Therefore, the demand in the spot market plays a significant role in a potential rally, which could lead to a more sustainable uptrend in Ethereum’s price.
Ethereum is currently in a phase of sideways consolidation, with traders closely watching for a breakout above the $3,700 level or a potential retracement towards $3,200. The spot market demand will likely continue to influence the price movement of Ethereum, determining whether the current rally is sustainable in the long run.


Leave a Reply