Ethereum, a pillar of the cryptocurrency ecosystem, is currently navigating a significant transitional phase, marked by notable chart patterns and liquidity factors. As traders and investors look for cues to navigate their strategies, understanding the technical intricacies involved can provide valuable insights. This article will dissect Ethereum’s current state, focusing on prevalent chart formations and critical liquidity zones that have the potential to instigate substantial price movements.
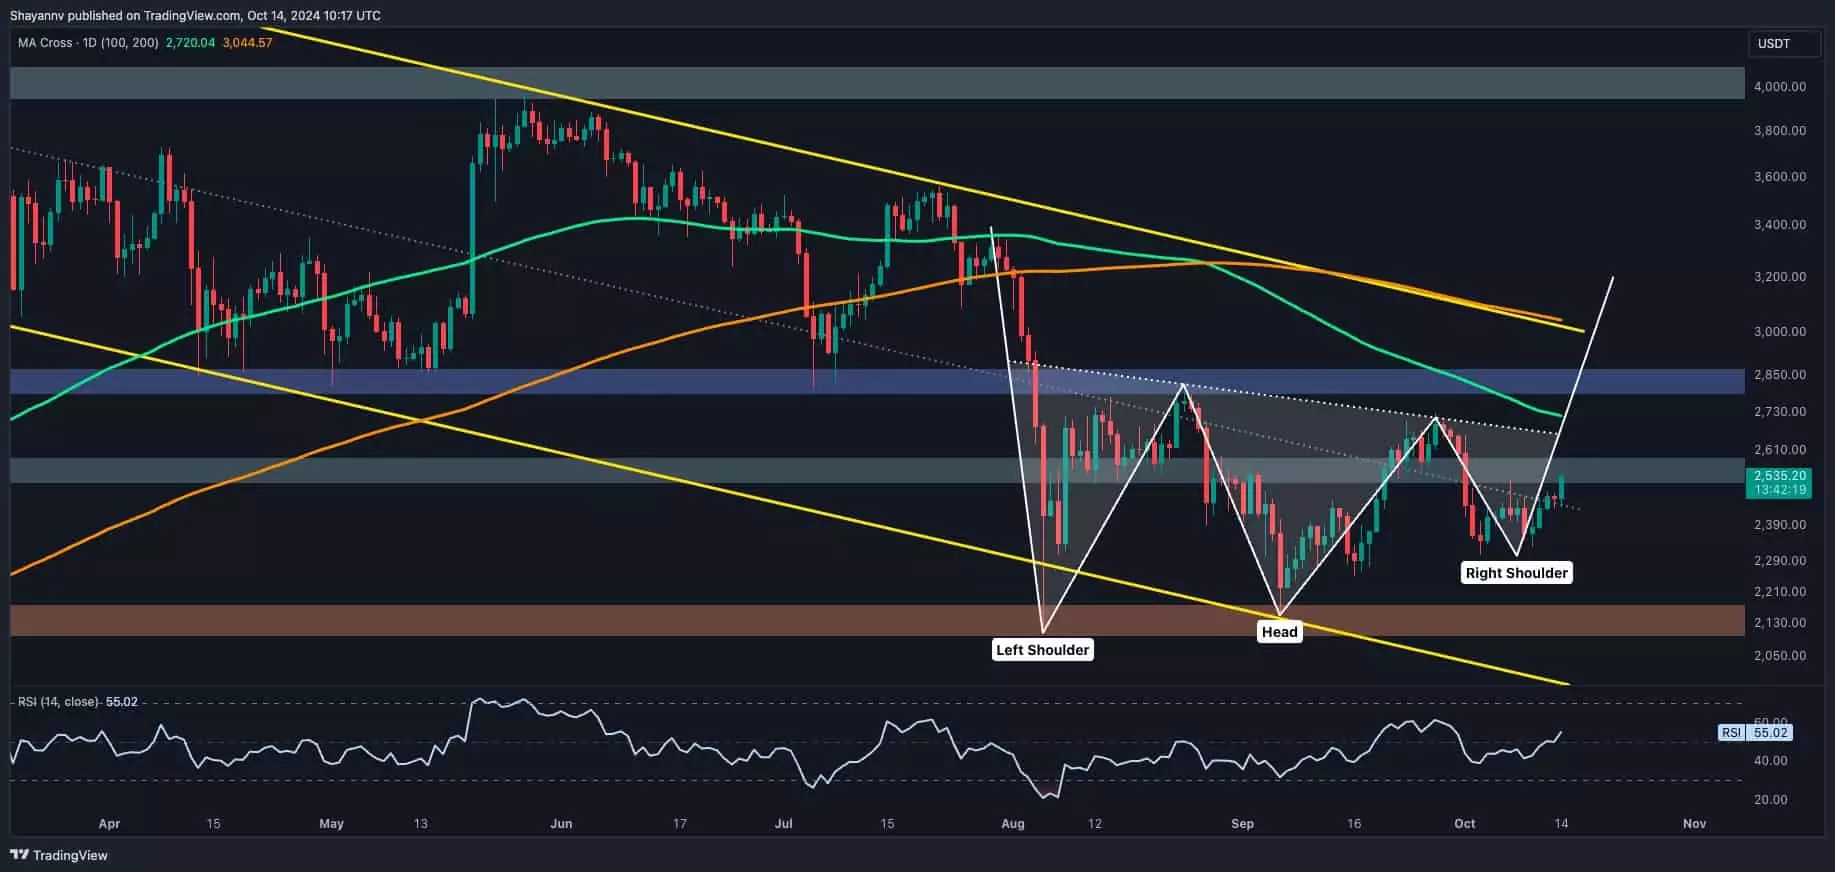
In the realm of technical analysis, chart patterns serve as pivotal indicators of future price direction. Presently, Ethereum appears to be forming an inverted head and shoulders pattern on the daily chart, an arrangement suggestive of potential bullish reversal. This pattern typically indicates the market’s intent to shift from a bearish to a bullish sentiment. The significance of the $2.1K support level cannot be overstated; it is here that buyers have shown resilience, managing to support the price amidst broader market fluctuations. If Ethereum breaks through the pattern’s neckline, situated at approximately $2.7K, it could signal a new bullish trajectory.
Additionally, an analysis of the 4-hour chart reveals a double-bottom formation, another bullish indication that might reinforce this positive sentiment. This structure usually hints at a weakening of selling pressure, suggesting an imminent price increase. However, for Ethereum to solidify this upward momentum, the breakdown of the $2.3K ascending flag support level could pose risks; failure to maintain above this level may trigger significant selling activity, potentially revisiting the $2.1K support zone.
Fibonacci retracement levels are also crucial in understanding Ethereum’s current pricing dynamics. The elusive price range between the 0.5 Fibonacci level at $2.6K and the 0.618 Fibonacci level around $2.8K represents key resistance points likely to influence traders’ decisions. Prices confined within this range experience low volatility, suggesting that the market is on the cusp of a decisive breakout—either upward or downward. A breakout past $2.6K could pave the way for further bullish advancements towards the $3K mark. Conversely, failing to breach this resistance could result in a substantial pullback.
Another critical aspect to consider is Ethereum’s recovery above the $2.5K midpoint of a longer-term range, which could signify a foundational step toward reclaiming a more bullish stance. Maintaining above this region is crucial for buyers seeking to shift the narrative from a descent towards a more upward trajectory.
As Ethereum grapples with price fluctuations, understanding liquidity zones is paramount. The Binance liquidation heatmap provides insightful data regarding areas of concentrated liquidity, chiefly reflecting the activity of larger market participants, including institutional players and whales. The region around $2K has emerged as a heavily defended support zone owing to the substantial liquidity pools entrenched, indicating significant buy orders capable of absorbing downward pressure.
Conversely, the concentration of liquidity observed around $2.8K creates a formidable resistance barrier. This niche could entice traders positioning their liquidation points, shaping the market’s behavior significantly. The result of a breakout—either upward or downward—could initiate a liquidation cascade, resulting in a rapid chain reaction of stop-loss orders and subsequent liquidations. Such scenarios may drastically amplify prevailing market trends, either reinforcing upward movements or catalyzing sharp declines.
Final Thoughts: Preparing for Potential Volatility
In light of the intricate interplay of chart patterns and liquidity zones, Ethereum stands on the threshold of volatility. The current formations suggest a bullish sentiment that could be realized if critical breaks occur. Investors should remain alert for pivotal movements around the defined price levels, keeping an eye on the potential for cascading liquidations or significant price shifts. Being equipped with a keen understanding of these dynamics can significantly enhance the strategic positioning of traders and investors alike in the exciting yet volatile world of cryptocurrency.


Leave a Reply