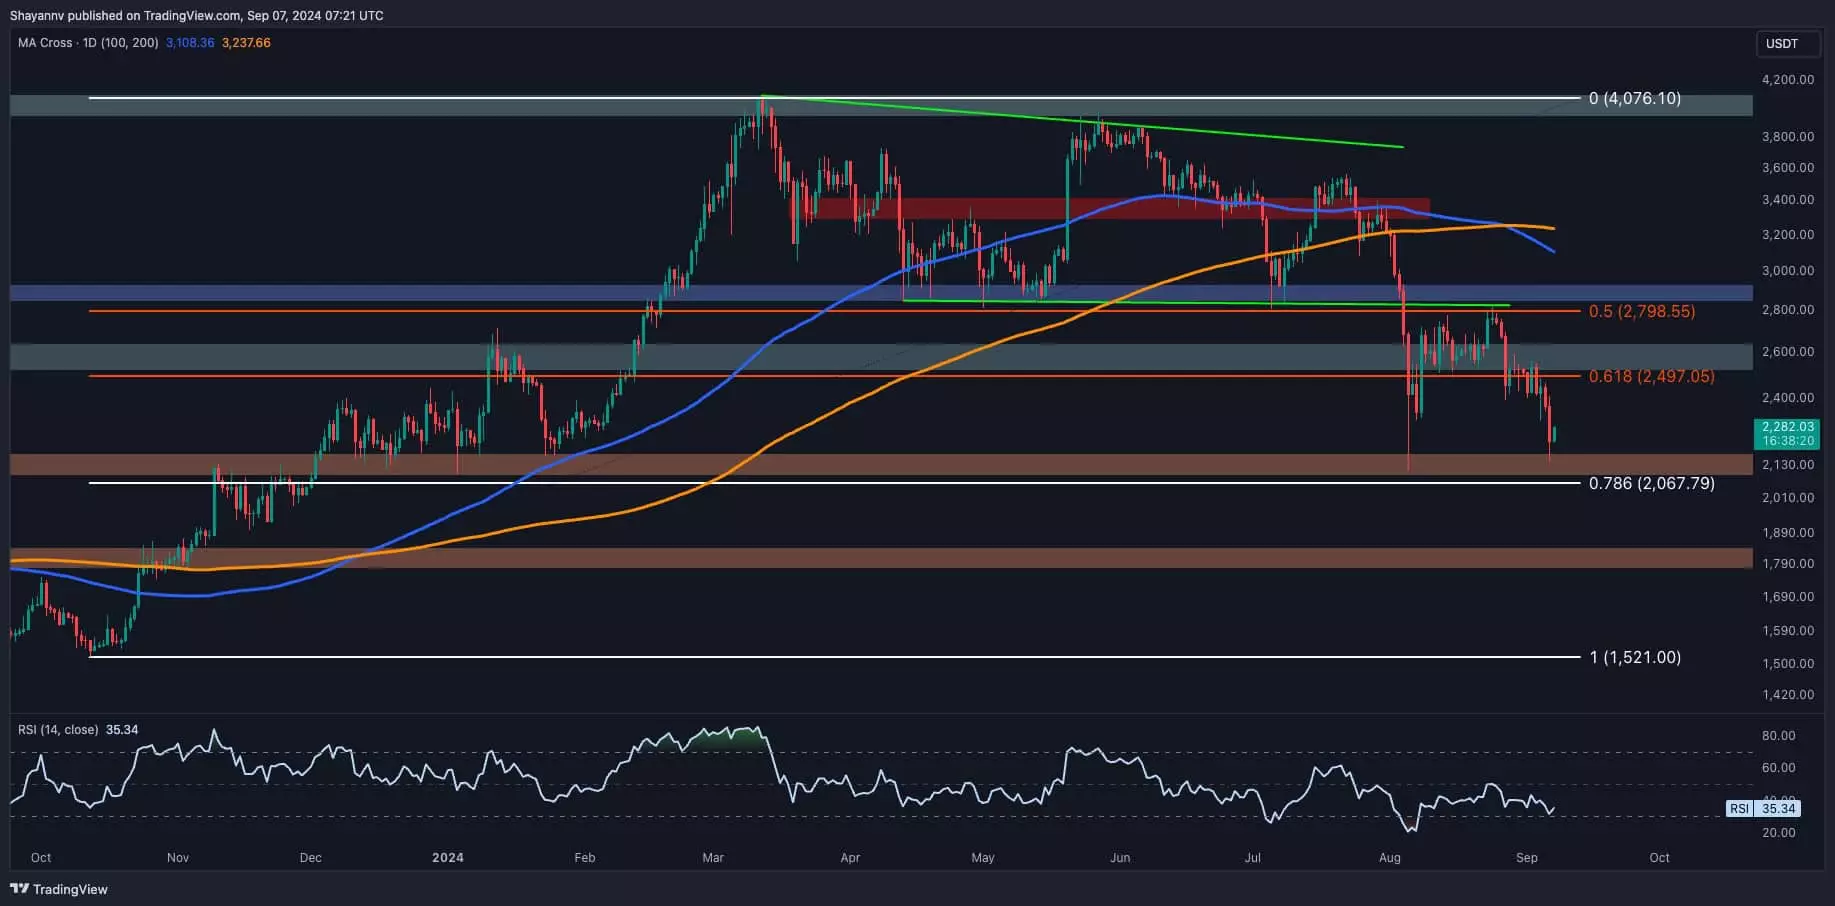
In recent times, Ethereum has been facing a bearish outlook, characterized by a significant downtrend. This negative trend has sparked fear and uncertainty among market participants, leading to a decrease in investor interest. The rejection at the lower boundary of a multi-month wedge and key Fibonacci levels has confirmed the presence of strong selling pressure in the market. Additionally, the formation of a death cross, where the 100-day moving average crosses below the 200-day moving average, has further dampened sentiment.
However, despite the prevailing bearish conditions, Ethereum is approaching a critical support level around $2.1K and the 0.786 Fibonacci retracement level at $2,067. This area is expected to attract substantial demand and could potentially result in a short-term sideways consolidation phase. It is crucial to monitor the price action around this support zone in the coming days to determine whether Ethereum can hold this level or if a deeper correction is imminent.
On the 4-hour chart, Ethereum faced a strong rejection from the resistance zone between the 0.5 ($2.6K) and 0.618 ($2.7K) Fibonacci levels, leading to continued bearish momentum towards the $2.1K support level. Historically, this support level has proven to be significant, particularly in early August, suggesting that buyers may step in to accumulate at these price levels.
If demand reemerges at the $2.1K mark, Ethereum could enter a temporary consolidation phase, alleviating the downward pressure on the price. However, a breach of this crucial support level could trigger a long-liquidation event, potentially pushing the price towards the $1.8K region. Therefore, the next few days will be crucial in determining the short-term price trajectory of Ethereum.
The value of Ethereum is intrinsically linked to the activity on its decentralized network and the engagement of its users. One key metric to assess this engagement is the number of unique active addresses on the network, which serves as a proxy for Ethereum’s overall market demand and valuation. The chart displaying the 14-day moving average of Ethereum Active Addresses reveals a sharp decline since late March 2024.
This downward trend in active addresses indicates a decrease in user activity and transaction volumes, reflecting a bearish sentiment in the market. To ignite a sustainable rally and potentially reverse this trend, Ethereum needs to see a resurgence in the number of active addresses. An increase in active addresses would signify growing interest in Ethereum, leading to higher demand and the possibility of a bullish market reversal.
Ethereum is currently at a crucial juncture, with the price nearing a critical support level amidst bearish market conditions. The coming days will be pivotal in determining whether Ethereum can hold this support and initiate a consolidation phase or if a deeper correction is on the horizon. Additionally, monitoring network activity and user engagement will provide valuable insights into Ethereum’s market demand and potential for a bullish reversal.


Leave a Reply