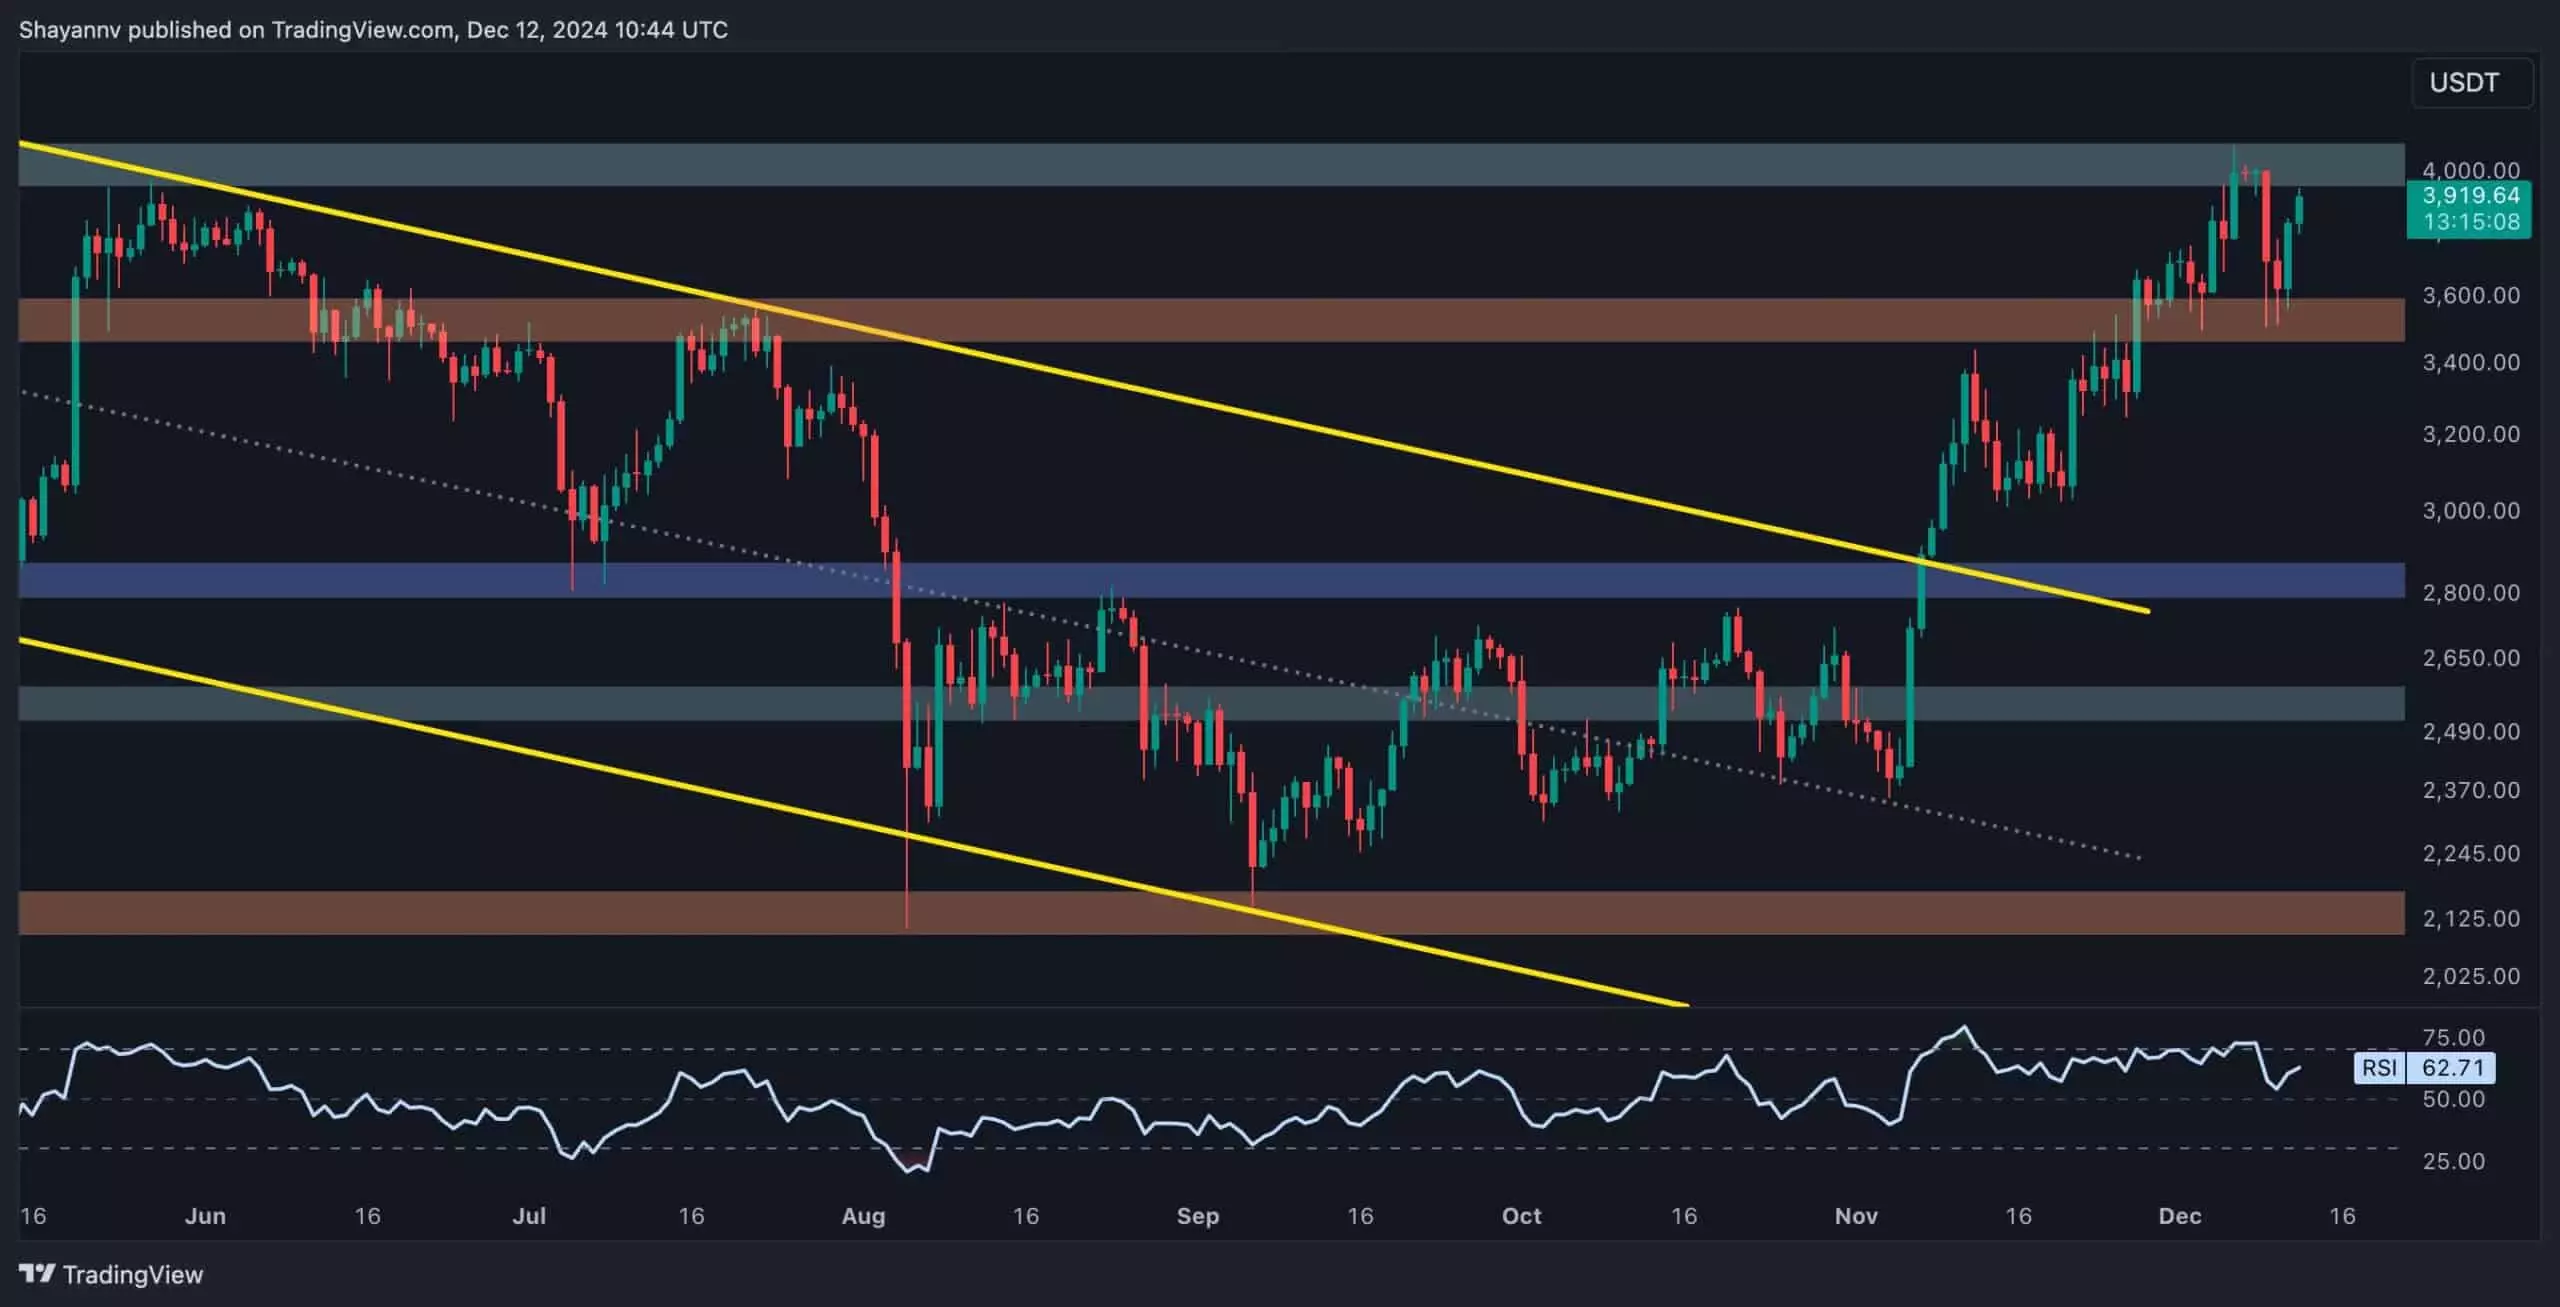
Ethereum has recently been treading water within a critical trading range between $3,500 and $4,000. This interval has become a battleground for bulls and bears alike, with notable price action while Ethereum personalities continue to weigh the cryptocurrency’s future trajectory. The lower boundary around $3,500 has emerged as robust support, evidenced by the recent price rebound from this level, which indicates buyers are stepping in to defend this key threshold. On the flip side, the $4,000 mark has become a significant resistance point, where bullish rallies seemingly face a formidable wall.
Despite attempts by bulls to rally past the $4,000 resistance, the price has faced repeated rejections, confirming this area as a pressure zone for selling activity. Each time Ethereum approaches this level, the market witnesses an influx of selling, which drives the price back toward the lower end of its established range. This cyclical behavior suggests that the $4,000 threshold harbors substantial liquidity, attracting short sellers who anticipate price dips. The recent price action illustrates the combined forces at play: bullish buyers eager to break through this barrier and bearish sellers ready to capitalize on potential reversals.
Further amplifying the uncertainty around Ethereum’s price movements is the observation of bearish divergence on the Relative Strength Index (RSI). While prices attempt to inch higher, the RSI fails to reflect similar strength, indicating underlying weakness and potential exhaustion among buyers. This divergence serves as a cautionary flag for traders, who might expect consolidation or minor pullbacks before any sustainable bullish breakout. This technical nuance reinforces the broader narrative of Ethereum’s fluctuating dynamics as it moves within the confines of the $3,500-$4,000 range.
Examining the liquidity landscape clarifies market mechanics driving Ethereum’s price action. The concentration of liquidity beneath the $3,500 support level suggests a significant buy wall, enticing traders to accumulate positions in anticipation of upward movements. Conversely, the liquidity around the $4,000 barrier, primarily comprised of short positions, hints at a volatile conundrum. If Ethereum can decisively break above this level, a scenario could unfold where short positions are rapidly unwound, leading to a cascade of buy orders that would further fuel the upward momentum.
The current market dynamics of Ethereum signal a period of consolidation awaits, primarily influenced by the established resistance and support levels. A breakout above $4,000 remains a pivotal marker that, if achieved, could herald significant bullish momentum. However, until we see decisive movement beyond these boundaries, traders should brace themselves for scenarios involving increased volatility, particularly as market participants engage with the transformed liquidity landscape. Ethereum’s navigation within the $3,500-$4,000 range serves as a fascinating case study for traders as they assess risk-reward scenarios and anticipate future trends in the evolving cryptocurrency space.


Leave a Reply