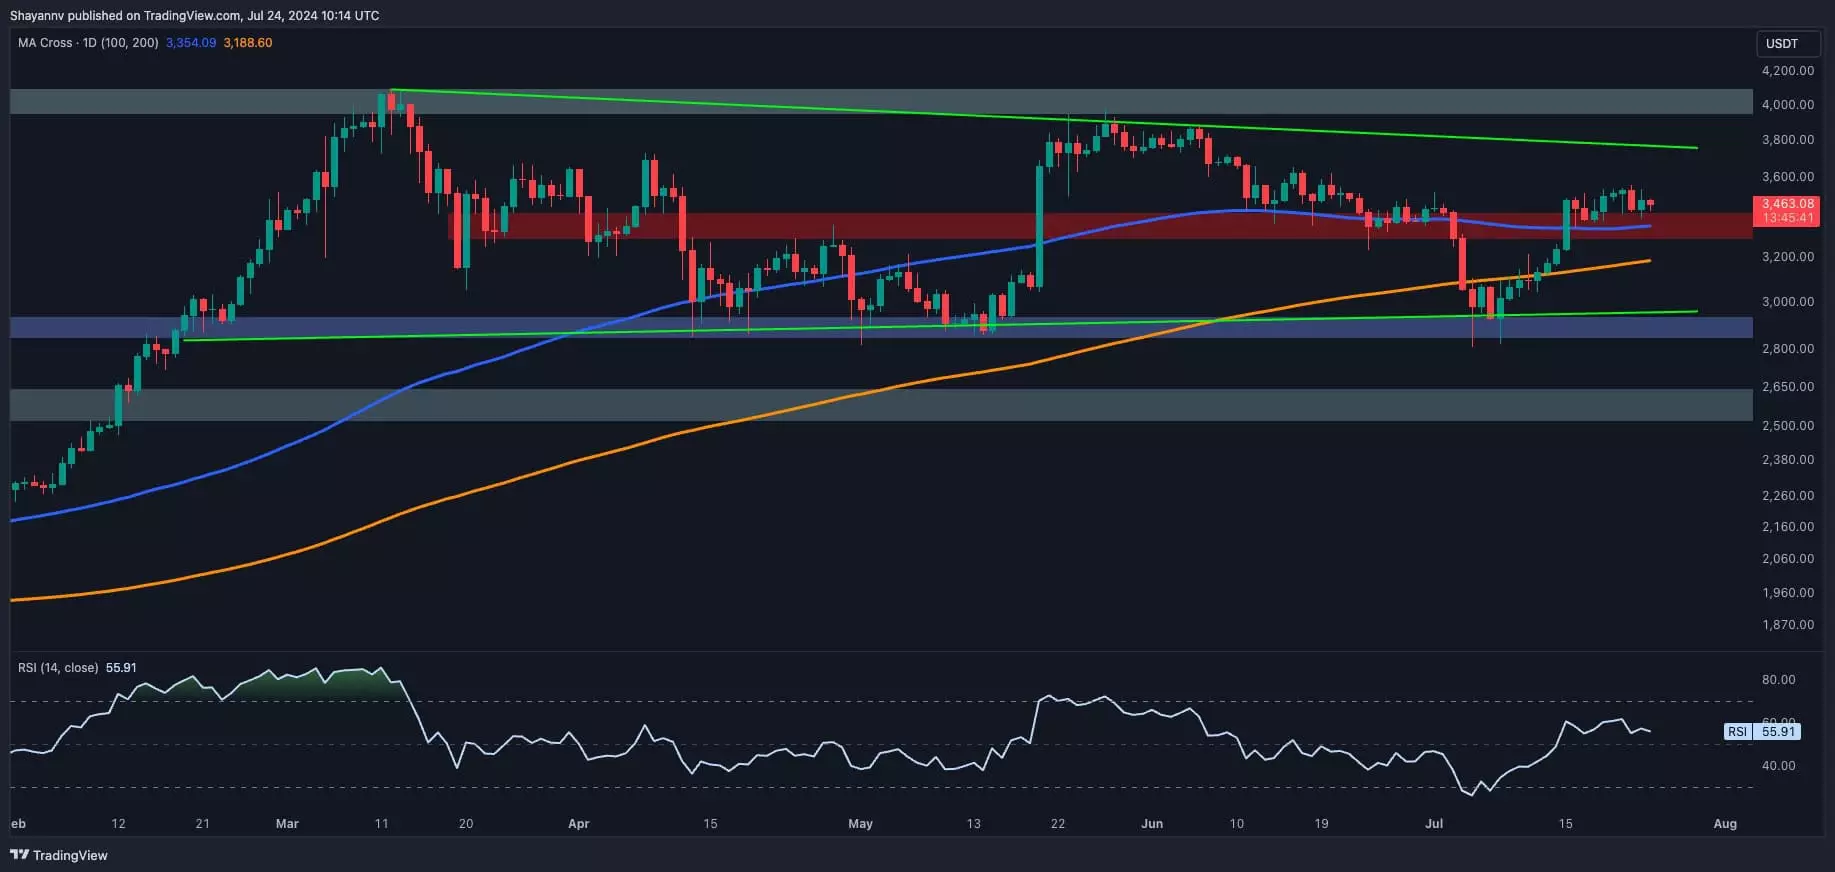
Ethereum’s price has been experiencing a period of consolidation above the 100 and 200-day moving averages, signaling a bullish trend in the market. The recent breakthrough above the critical 100-day moving average at $3,354 has led to a phase of sideways fluctuation, indicating a balance between buyers and sellers. However, with the introduction of spot ETH ETFs and a substantial inflow of $106.6 million on their debut, a surge in buying interest for Ethereum is expected. This renewed interest is likely to drive the price towards the upper boundary of the wedge pattern at $3.7K, setting the stage for a continuation of the bullish rally. The price action is currently enclosed within a crucial range defined by the upper boundary at $3.7K and significant support at $3.4K, with a bullish breakout appearing more probable in the near future.
On a closer look at the 4-hour chart, Ethereum buyers have been facing resistance in surpassing the previous major swing high of $3.5K, resulting in a period of sideways consolidation. The formation of an ascending wedge pattern during this consolidation phase typically signifies a bearish reversal. However, given the prevailing bullish sentiment in the market, there is anticipation of renewed demand leading to a breakout above the wedge pattern. In the case of an unforeseen bearish breakout, the price may undergo a short-term retracement before embarking on its next impulsive bullish move. This potential bearish scenario could present an opportunity for market participants to accumulate ETH at lower prices, capitalizing on the temporary price dip.
As Ethereum’s price rebounds from below the $3K mark and with the official launch of ETH Spot ETFs, analyzing investor behavior using on-chain metrics can offer valuable insights into recent market dynamics and potential future trends. The Ethereum Exchange Reserve metric, which tracks the amount of ETH held in exchange wallets, serves as a key indicator of investor sentiment. A decrease in exchange reserves indicates accumulation by long-term holders, as coins are withdrawn from exchanges for storage, while an increase suggests selling pressure from investors depositing coins on exchanges for trading purposes. Recent data highlights a rapid decline in the exchange reserve metric, particularly following the news of the forthcoming launch of Spot ETFs in July. This downward trend implies that numerous large investors have seized the opportunity presented by the recent market correction to accumulate ETH at a lower price. As these investors withdraw their coins from exchanges, the available supply diminishes, signaling a shift towards long-term holding strategies. The combination of reduced supply and growing buying interest catalyzed by the introduction of Spot ETFs sets the stage for a potential sustained rally in the following months.
Ethereum’s price trajectory, influenced by market dynamics, investor behavior, and external factors such as the launch of Spot ETFs, is poised for significant movements in the near term. By closely monitoring key indicators and staying abreast of market developments, investors can gain valuable insights into Ethereum’s future performance and make informed decisions to navigate the evolving cryptocurrency landscape.


Leave a Reply